Which two types of visualizations can be used in the balance sheet reports to meet the reporting goals? Each correct answer presents part of the solution.
NOTE: Each correct selection is worth one point.
You need to ensure that the data is updated to meet the report requirements. The solution must minimize configuration effort.
What should you do?
Which DAX expression should you use to get the ending balances in the balance sheet reports?
Note: This question is a part of a series of questions that present the same scenario. For your convenience, the scenario is repeated in each question. Each question presents a different goal and answer choices, but the text of the scenario is exactly the same in each question in this series.
Start of repeated scenario
You have a Microsoft SQL Server database that has the tables shown in the Database Diagram exhibit. (Click the Exhibit.)
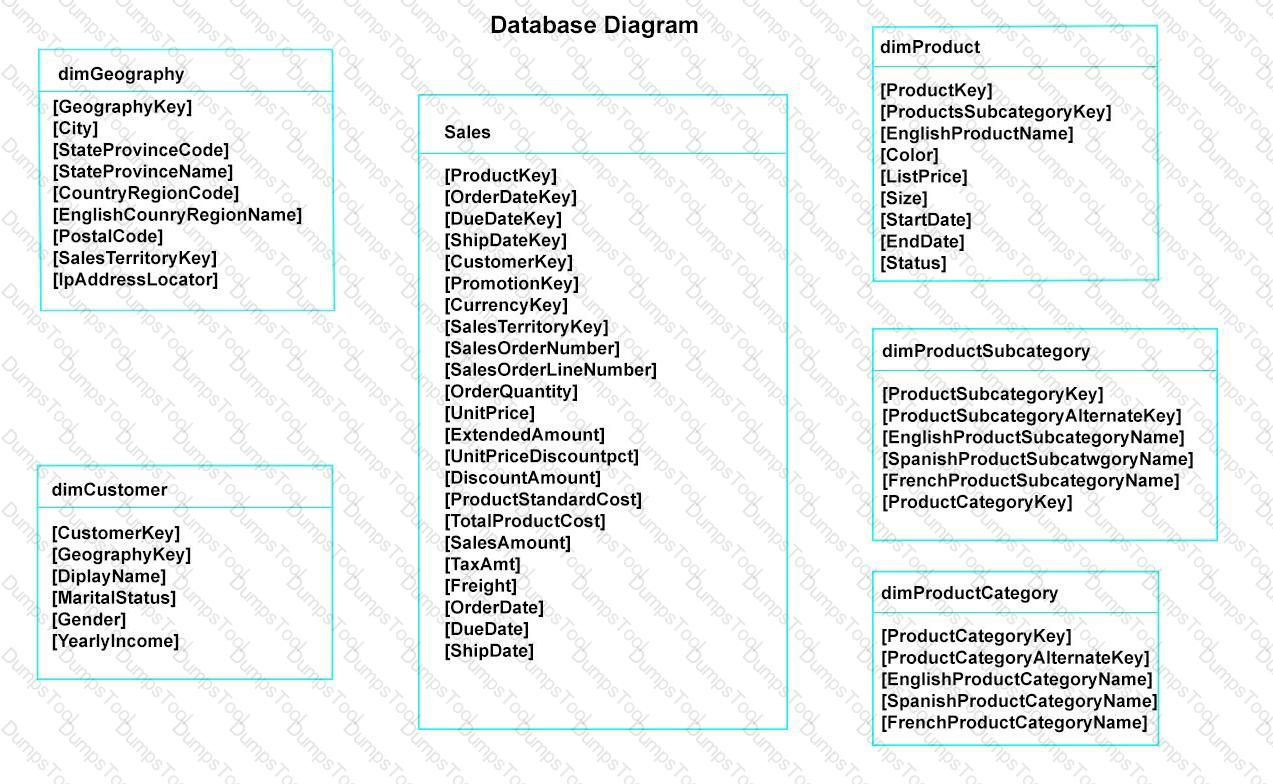
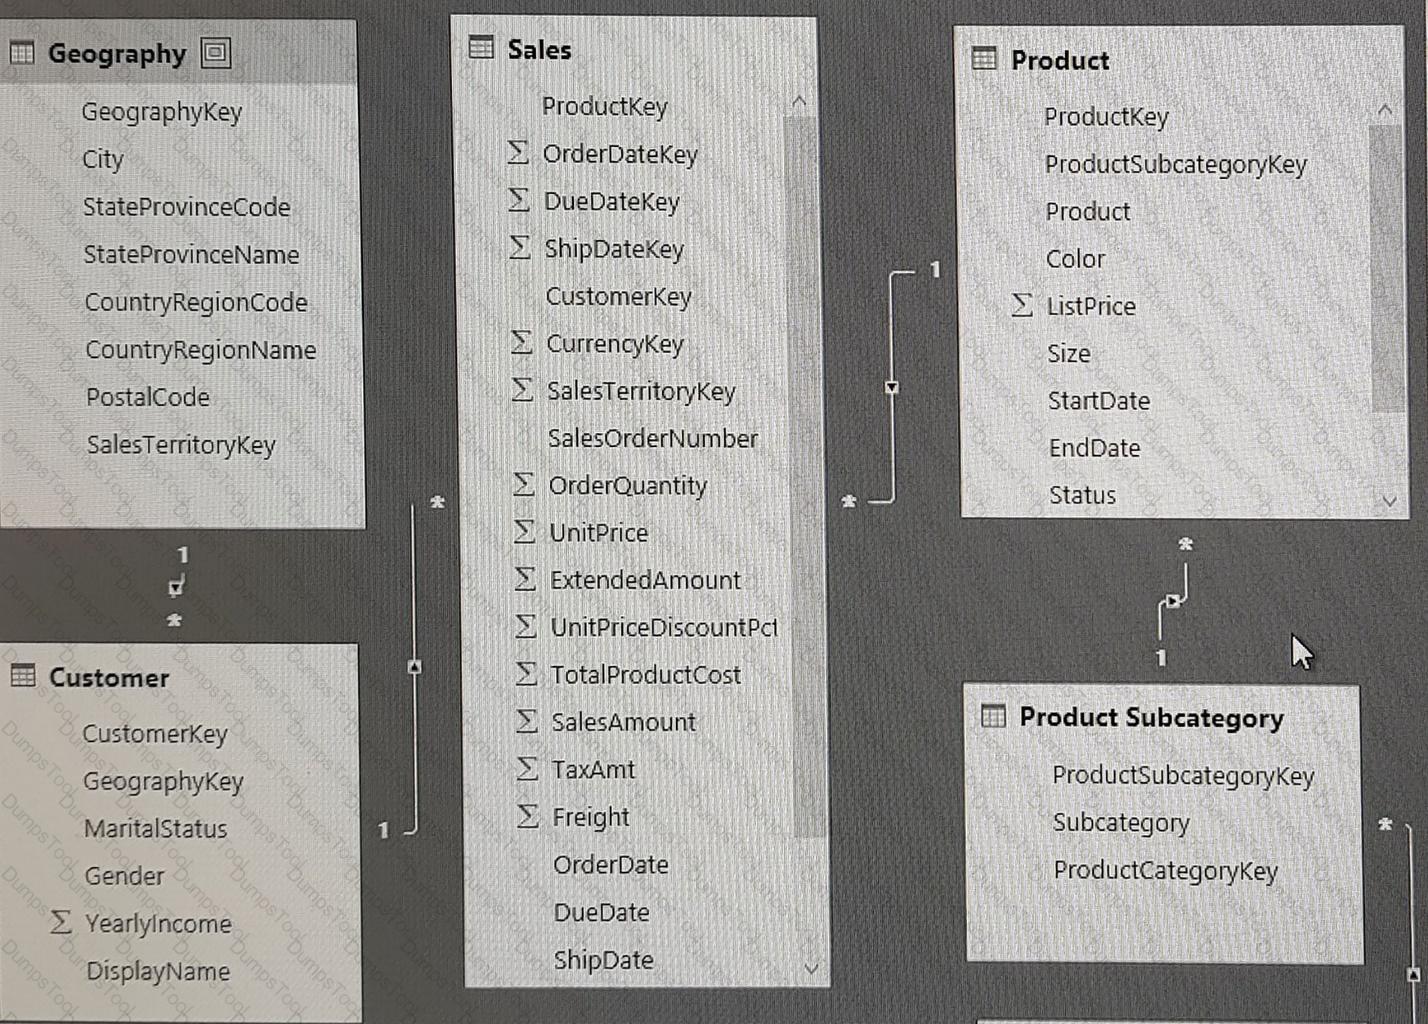
You plan to develop a Power BI model as shown in the Power BI Model exhibit. (Click the Exhibit).
You plan to use Power BI to import data from 2013 to 2015.
Product Subcategory [Subcategory] contains NULL values.
End of repeated scenario.
You implement the Power BI model.
You add another table named Territory to the model. A sample of the data is shown in the following table.
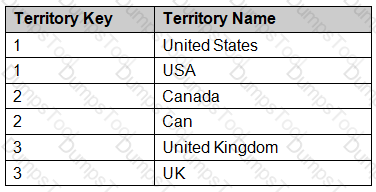
You need to create a relationship between the Territory table and the Sales table.
Which function should you use in the query for Territory before you create the relationship?
You have a report that contains a donut chart and a clustered column chart. Interactions between the visuals use the default settings.
You need to modify the report so that when you select a column m the column chart, the donut chart redraws by using the data from the selected column.
What should you do?
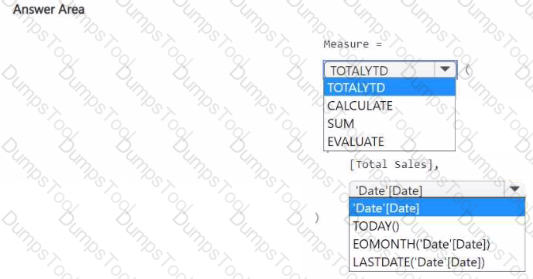
You have a Power Bl report that contains a measure named Total Sales.
You need to create a new measure that will return the sum of Total Sates for a year up to a selected date. How should you complete the DAX expression? To answer, select the appropriate options in the answer area.
NOTE: Each correct selection is worth one point.
You have a Power Bl report.
You have the following tables.
You have the following DAX measure.

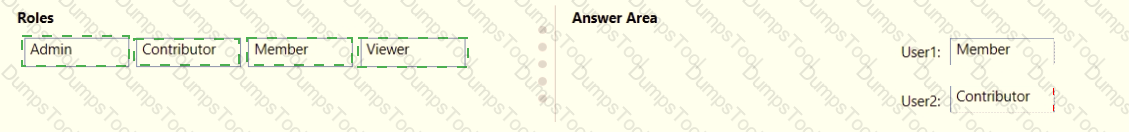
You have a Microsoft Power Bl workspace.
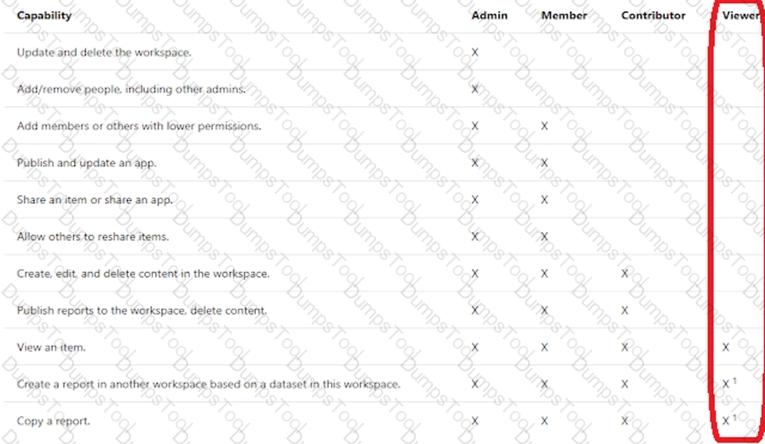
You need to grant the user capabilities shown in the following table.
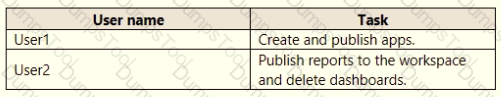
The solution must use the principle of least privilege.
Which user role should you assign to each user? To answer, drag the appropriate roles to the correct users. Each role may be used once, more than once, or not at all. You may need to drag the split bar between panes or scroll to view content.
NOTE: Each correct selection is worth one point.

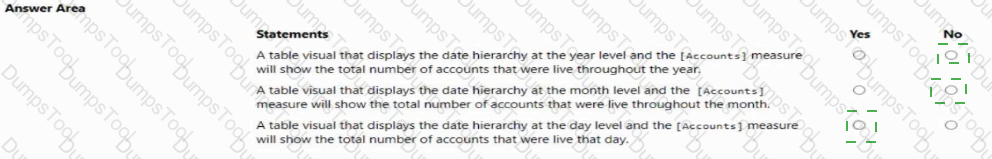
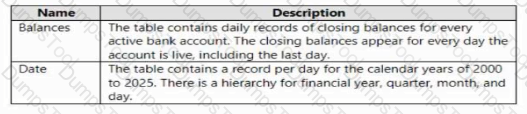
You have a Power Bl model that contains two tables named Population and Date.
The Population table contains two columns named Population Amount and Date Key.
DateKey contains date values that represent the first day of a year and are used to create a many-to
The Power Bl model contains two measures that have the following definitions.
Total Population = Sum ('Population'[Population Amount])
2023 Population = CALCULATE ([Total Population]"Date'[Year] = 2023)
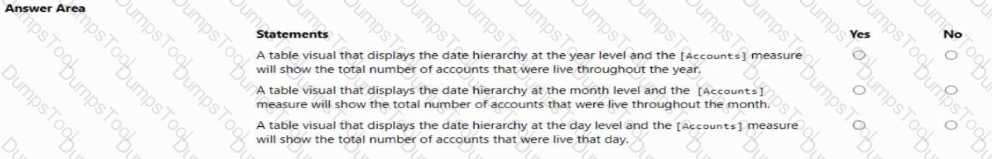
You create a table visual that displays Date[Year] and [2023 Population].
What will the table visual show?
ion have a Power BI dataset that contains a table named Temperature Readings. Temperature Readings contains the columns shown in the following table.
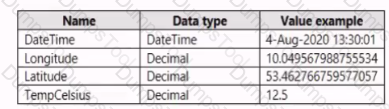
The table has 12 million rows. All the columns are needed for analysis.
You need to optimize the dataset to decrease the model size. The solution must not affect the precision of the data.
What should you do?
-
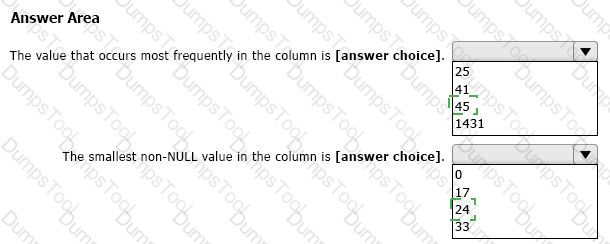
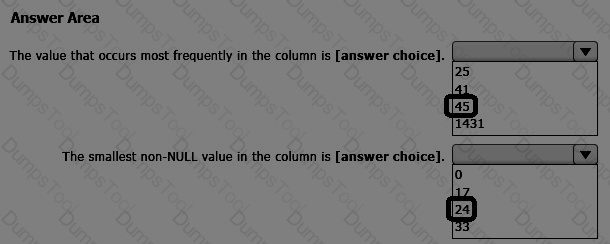
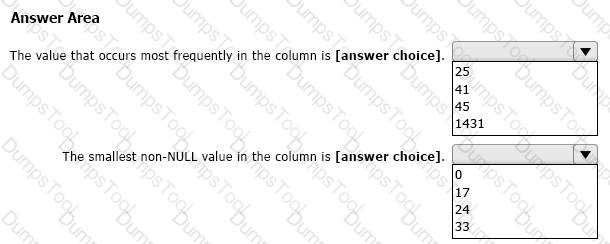
You are using Power Query Editor to preview the data in a column named Max Temp. The column statistics and value distribution are shown in the following exhibit.
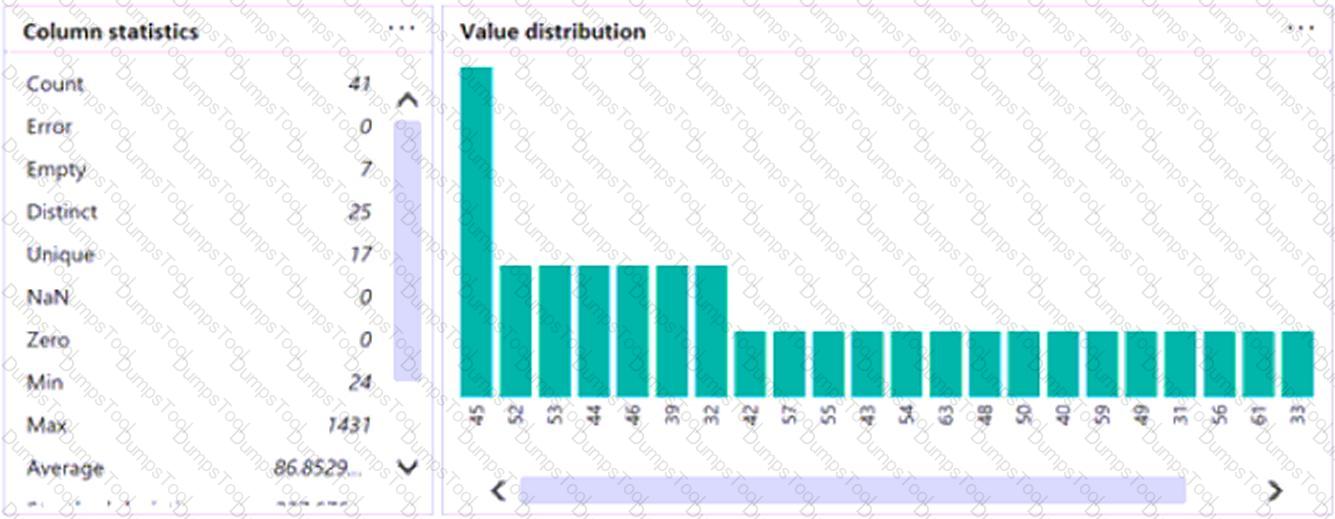
Use the drop-down menus to select the answer choice that completes each statement based on the information presented in the graphic.
NOTE: Each correct selection is worth one point.
You have a CSV file that contains user complaints. The file contains a column named Logged. Logged contains the date and time each complaint occurred. The data in Logged is in the following format: 2018-12-31 at 08:59.
You need to be able to analyze the complaints by the logged date and use a built-in date hierarchy.
What should you do?
Note: This question is part of a series of questions that present the same scenario. Each question in the series contains a unique solution that might meet the stated goals. Some question sets might have more than one correct solution, while others might not have a correct solution.
After you answer a question in this section, you will NOT be able to return to it. As a result, these questions will not appear in the review screen.
You have a Microsoft Excel workbook that is saved to Microsoft SharePoint Online. The workbook contains several Power View sheets.
You need to recreate the Power View sheets as reports in the Power Bl service.
Solution: From the Power Bl service, get the data from SharePoint Online, and then click Connect
Does this meet the goal?
You have a Power BI dashboard that displays different visualizations of company sales.
You enable Q&A on the dashboard.
You need to provide users with sample questions that they can ask when using Q&A.
Which settings should you modify from the Power BI Settings?
You are creating a query to be used as a Country dimension in a star schema.
A snapshot of the source data is shown in the following table.
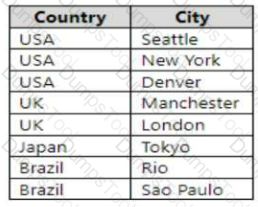
You need to create the dimension. The dimension must contain a list of unique countries.
Which two actions should you perform? Each correct answer presents part of the solution.
You have an Azure SQL database that contains sales transactions. The database is updated frequently.
You need to generate reports from the data to detect fraudulent transactions. The data must be visible within five minutes of an update.
How should you configure the data connection?
Adding an index key and normalizing casing in the data source would help resolve issues with undefined values and errors in a case-sensitive column. The index key can provide a unique identifier, and normalizing casing ensures consistency in the data, which would likely prevent the errors you encountered in the Power BI semantic model.
You have a Power BI data model that imports a date table and a sales table from an Azure SQL database data source. The sales table has the following date foreign keys.
•Due Date
•Order Date
•Delivery Date
You need to support the analysis of sales over time based on all three dates at the same time.
Solution: You create measures that use the USERELATIONSHIP DAX function to filter sales on the inactive relationships between sales table and the date table.
Does this meet the goal?
STION NO: 30
You have a Microsoft Power Bl report. The size of PBIX file is 550 MB. The report is accessed by using an App workspace in shared capacity of powerbi.com.
The report uses an imported dataset that contains one fact table. The fact table contains 12 million rows. The dataset is scheduled to refresh twice a day at 08:00 and 17:00.
The report is a single page that contains 15 custom visuals and 10 default visuals.
Users say that the report is slow to load the visuals when they access and interact with the report
You need to recommend a solution to improve the performance of the report.
What should you recommend?
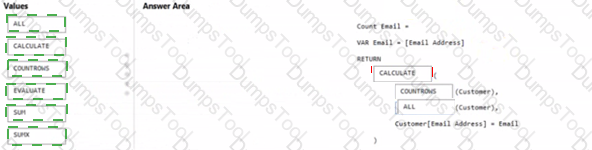
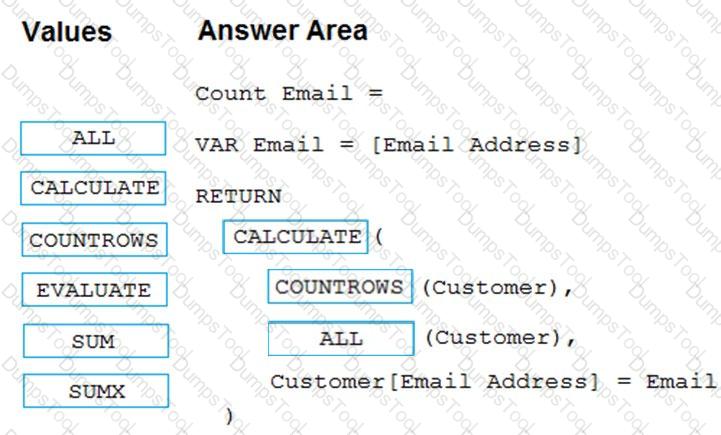
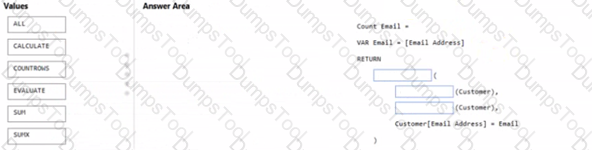
You have a Power Bl table named Customer that contains a field named Email Address.
You discover that multiple records contain the same email address.
You need to create a calculated column to identify which records have duplicate email addresses.
How should you complete the OAX expression for the calculated column? To answer, drag the appropriate values to the correct targets. Each value may be used once, more than once, or not at all. You may need to drag the split bar between panes or scroll to view content
NOTE: Each correct selection is worth one point.
You need to get data from the Microsoft SQL Server tables. What should you use to configure the connection'
You need to create a calculated column to display the month based on the reporting requirements. Which DAX expression should you use?
Note: This question is part of a series of questions that present the same scenario. Each question in the series contains a unique solution that might meet the stated goals. Some question sets might have more than one correct solution, while others might not have a correct solution.
After you answer a question in this section, you will NOT be able to return to it. As a result, these questions will not appear in the review screen.
You have a query for a table named Sales. Sales has a column named CustomerlD. The Data Type of CustomerlD is Whole Number.
You refresh the data and find several errors. You discover that new entries in the Sales table contain nonnumeric values.
You need to ensure that nonnumeric values in the CustomerlD column are set to 0.
Solution: From Query Editor, select the CustomerlD column and click Remove Errors.
Does this meet the goal?
You merge data from Sales.Region, Region_Manager, Sales_Manager, and Manager into a single table named Region. What should you do next to meet the reporting requirements of the executives?
You need to address the data concerns before creating the data model. What should you do in Power Query Editor?
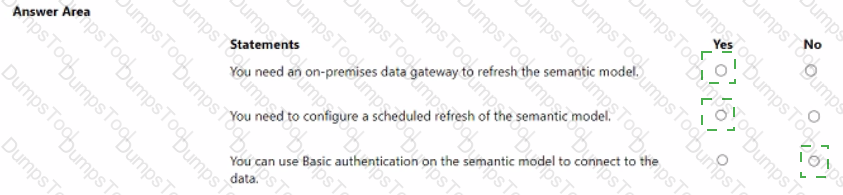
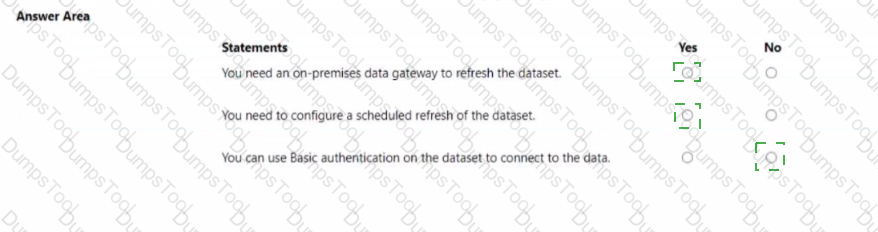
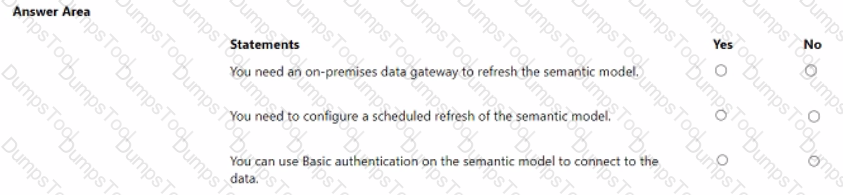
You publish the semantic model to powerbi.com.
For each of the following statements, select Yes if the statement is true. Otherwise, select No.
NOTE: Each correct selection is worth one point.
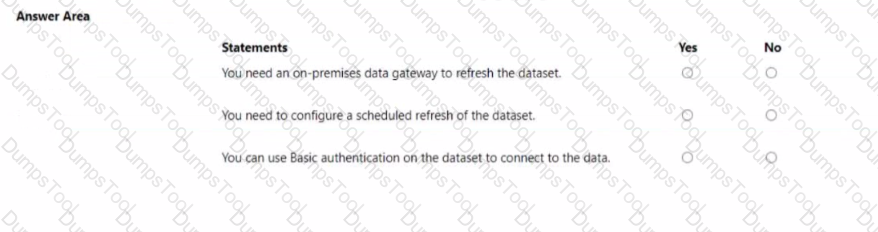
You publish the dataset to powerbi.com.
For each of the following statements, select Yes if the statement is true. Otherwise, select No.
NOTE: Each correct selection is worth one point.
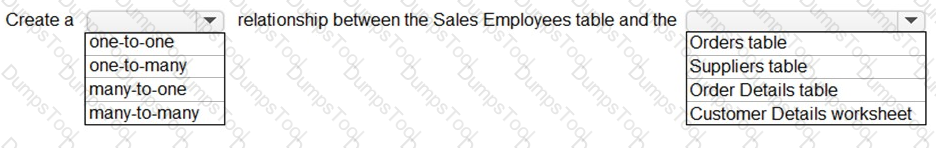
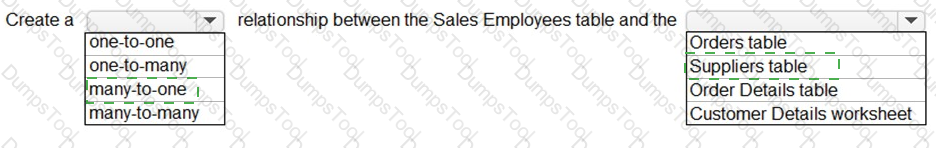
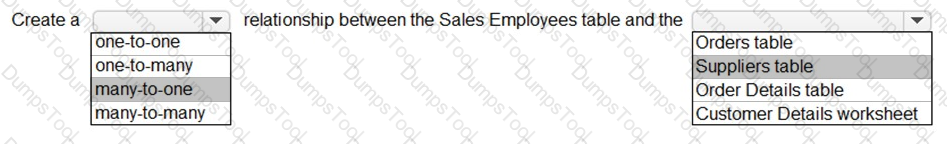
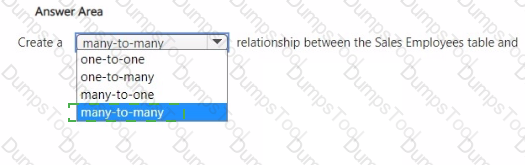
You need to create relationships to meet the reporting requirements of the customer service department.
What should you create?
You need to create the required relationship for the executive's visual. What should you do before you can create the relationship?
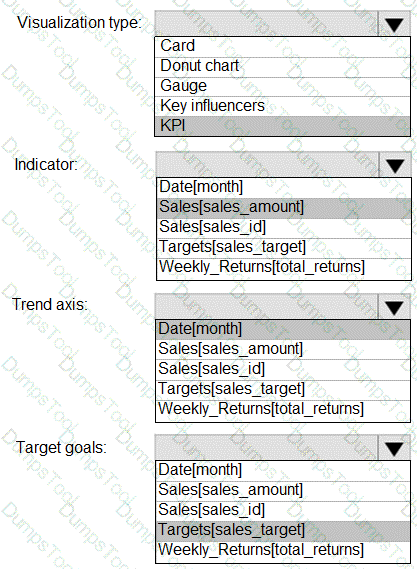
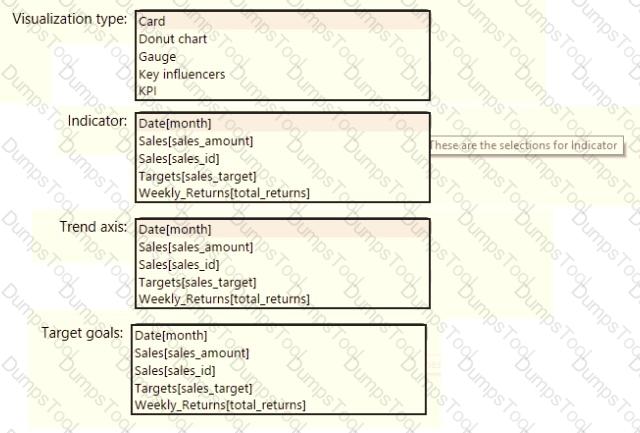
You need to create a visualization to meet the reporting requirements of the sales managers.
How should you create the visualization? To answer, select the appropriate options in the answer area.
NOTE: Each correct selection is worth one point.
You need to create a relationship between the Weekly_Returns table and the Date table to meet the reporting requirements of the regional managers. What should you do?
What should you create to meet the reporting requirements of the sales department?
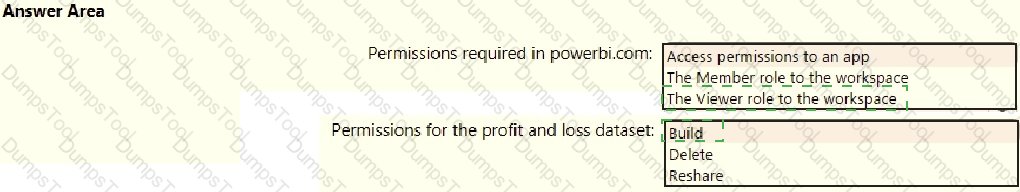
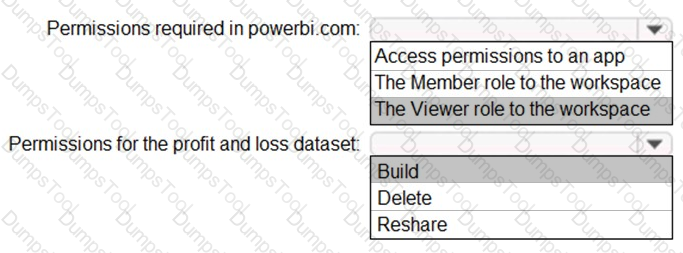
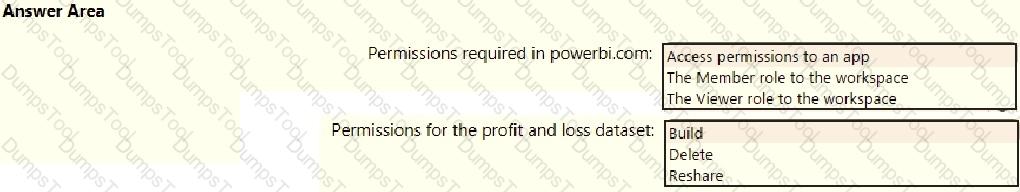
You need to grant access to the business unit analysts.
What should you configure? To answer, select the appropriate options in the answer area.
NOTE: Each correct selection is worth one point.
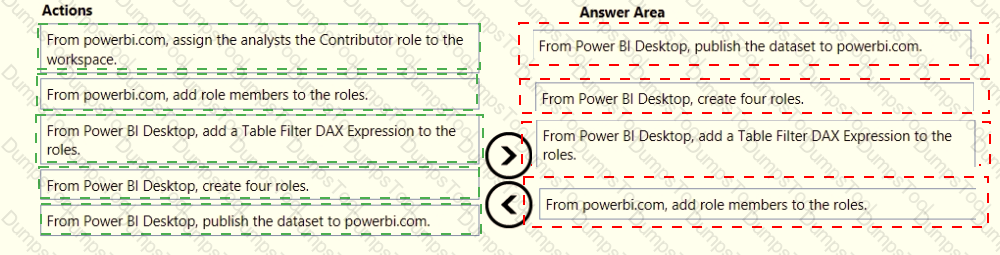
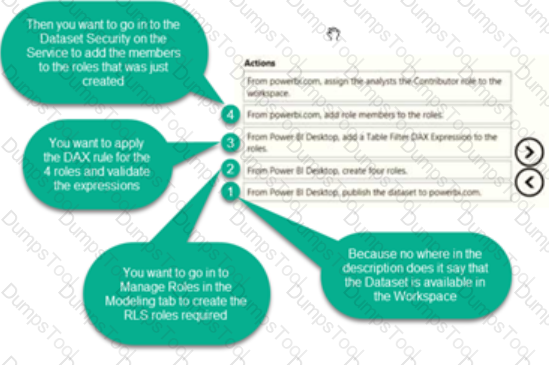
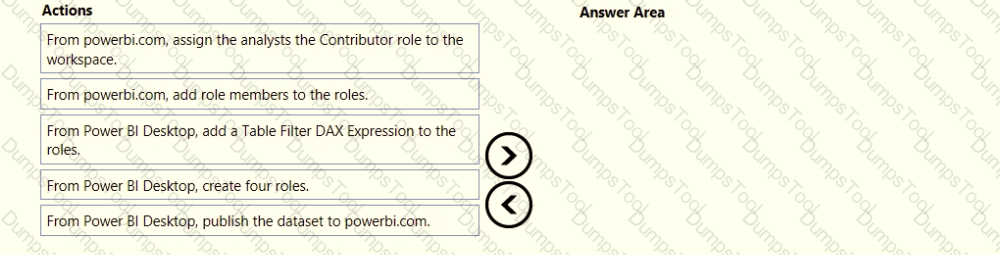
Once the profit and loss dataset is created, which four actions should you perform in sequence to ensure that the business unit analysts see the appropriate profit and loss data? To answer, move the appropriate actions from the list of actions to the answer area and arrange them in the correct order.
What is the minimum number of datasets and storage modes required to support the reports?
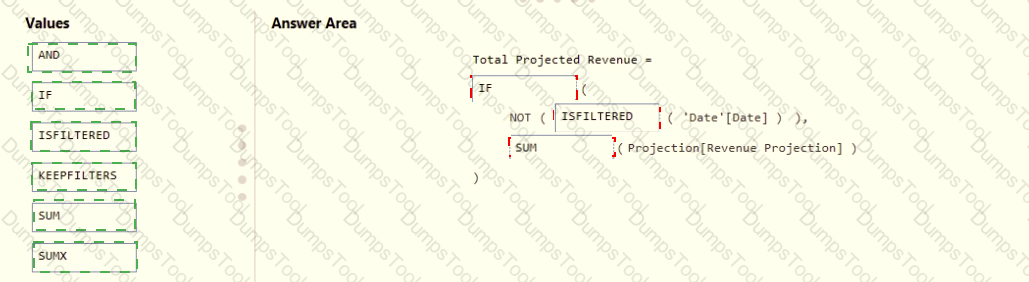
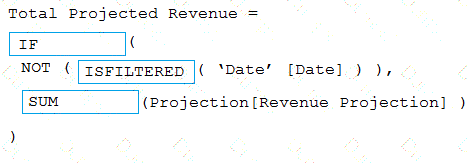
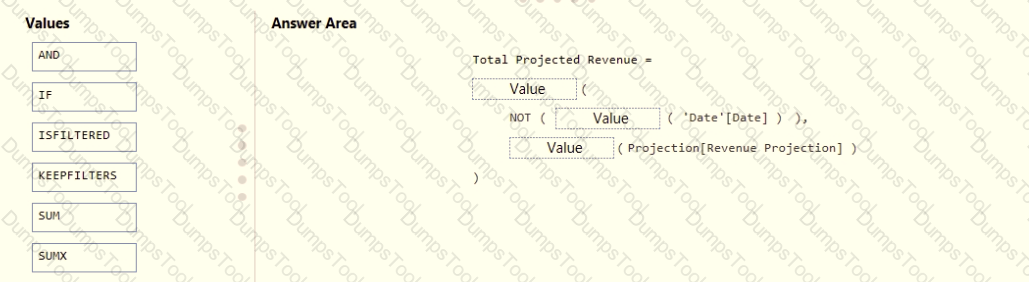
You need to create a DAX measure in the data model that only allows users to see projections at the appropriate levels of granularity.
How should you complete the measure? To answer, drag the appropriate values to the correct targets. Each value may be used once, more than once, or not at all. You may need to drag the split bar between panes or scroll to view content.
NOTE: Each correct selection is worth one point.
You need to configure access for the sales department users. The solution must me meet the security requirements. What should you do?
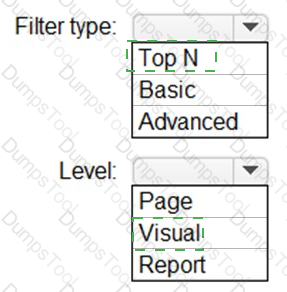
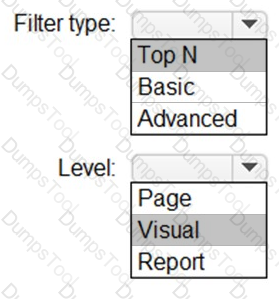
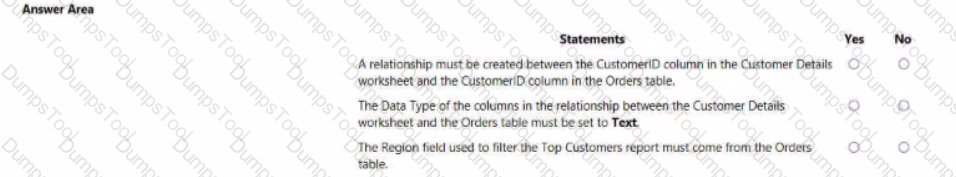
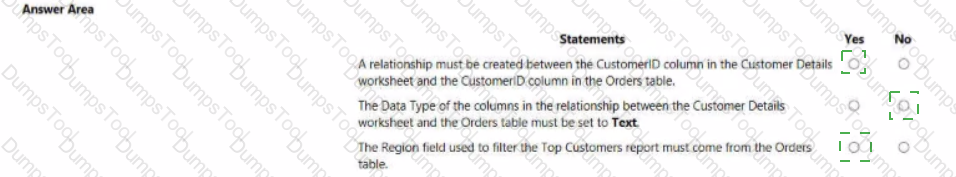
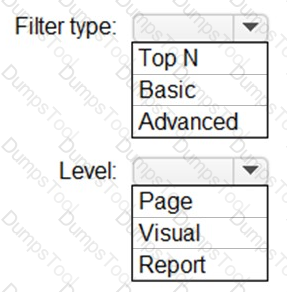
You need to create the Top Customers report.
Which type of filter should you use, and at which level should you apply the filter? To answer, select the appropriate options in the answer area.
NOTE: Each correct selection is worth one point.
You need to minimize me size of the dataset. The solution must meet the report requirements What should you do?
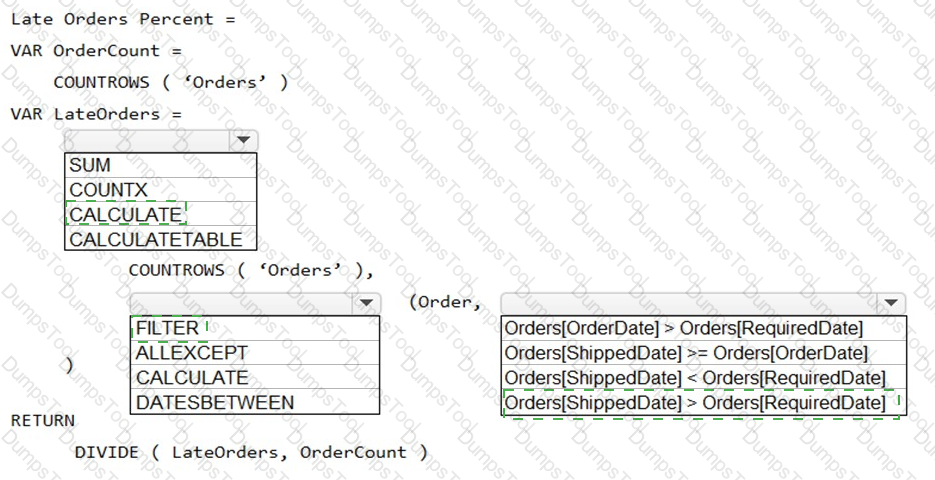
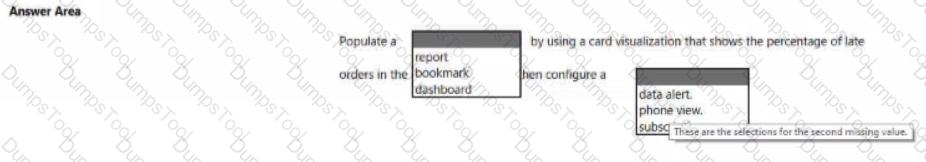
You need to create the On-Time Shipping report. The report must include a visualization that shows the percentage of late orders.
Which type of visualization should you create?
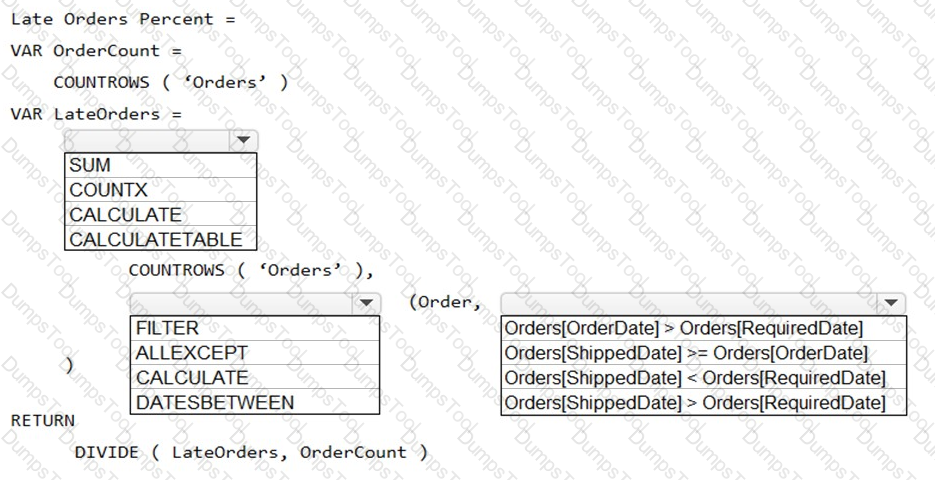
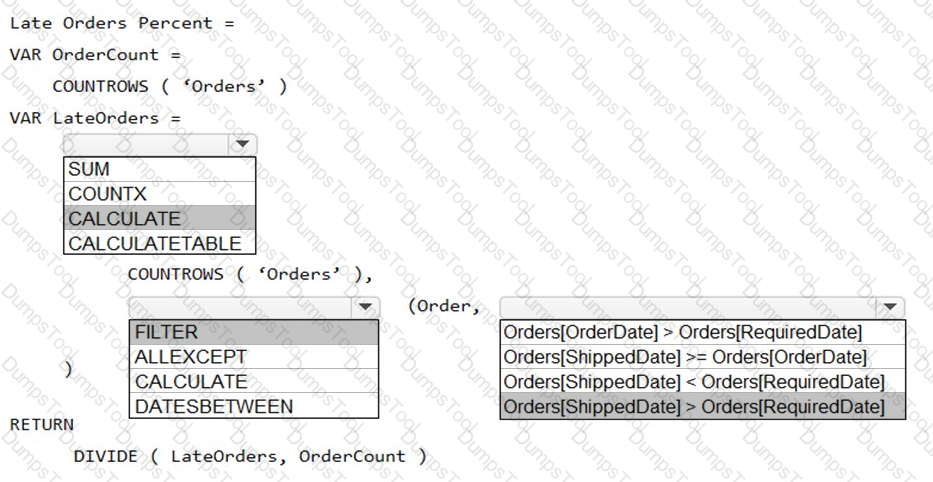
You need to create a measure that will return the percentage of late orders.
How should you complete the DAX expression? To answer, select the appropriate options in the answer area.
NOTE: Each correct selection is worth one point.